Warning: "It's a trap!"
Your Test Is Too Broad, Pitfall.
Focusing exclusively on late-stage Purchase Funnel KPIs - introducing a Carry-Over Effect, Pitfall
In challenging economic climates, businesses prioritize revenue and profitability to ensure sustainability. This is also our observation. A growing number of clients focus on experimentation. They rely on Average Revenue Per User (ARPU) as their primary success metric. As a result, recognizing some fundamental challenges with ARPU attribution bear mention. For example, ARPU has a direct impact on causality, affecting result accuracy.
Some Background on A/B Testing and Randomization:
- Page Views: select either version A or version B at random for each displayed page.
- Sessions: are a series of page views grouped by user over a specific time-frame. Session-level randomization shows either version A or B during a session.
- Users: Users represent individuals or close approximations. Logging in provides clear identification with a userID. Cookies work for sites without logins, but you lose them if cleared, devices switch, or the browser is changed. That’s why they remain an approximation. In user-level randomization, users view either version A or B consistently.
Independence Assumption of randomization units
Session-level randomization is an approach frequently employed, especially in the context of e-commerce websites. It can be combined with easily accessible metrics such as session conversion rate, which measures the percentage of sessions that result in a purchase. When implementing session-level randomization for your experiment on an e-commerce site, the process might resemble the following:
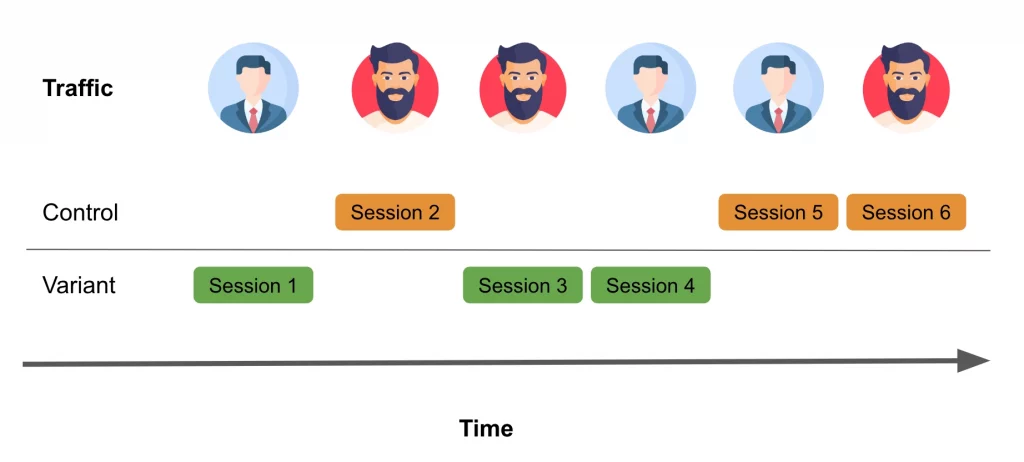
Consider the following scenario:
Aaron visits a website and initiates a session randomly assigned to the control group, experiencing version A throughout that session. Meanwhile, Bill visits the same site but is exposed to version B during his session.
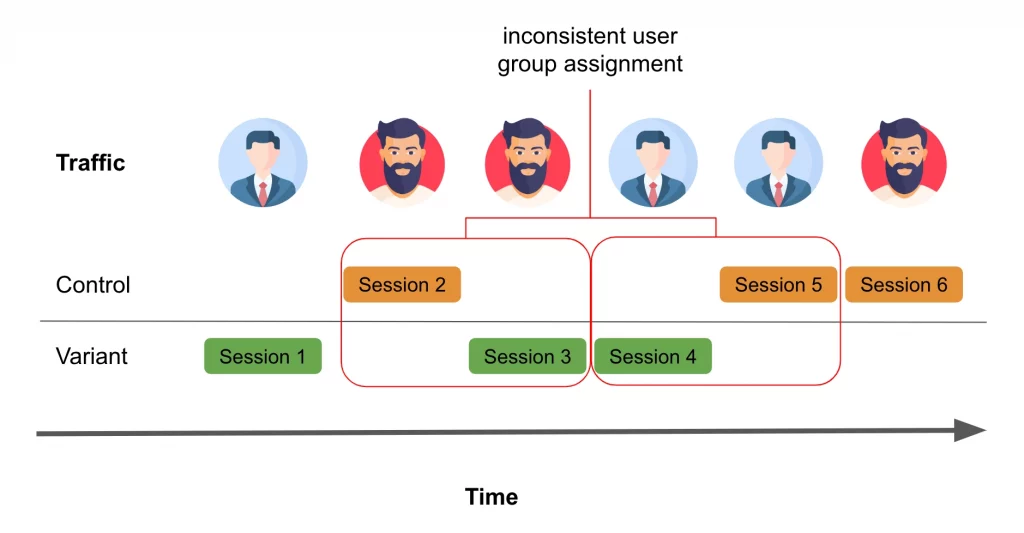
Later, Bill returns to the site on a different day, starting a new session that, by chance, is assigned to the version A experience. At first glance, this may appear to be a reasonable approach. However, what if Bill’s decision to return to the website was influenced by the version B experience from their previous session?
In the realm of online shopping, it’s not unusual for users to visit a website multiple times before making a purchase decision. Here lies the challenge with session-level randomization: it assumes that each session is entirely independent. This assumption can be problematic because the driving force behind these sessions is people, and people have memories.
To illustrate this issue further, let’s consider an example where we conduct an A/B test on a new product recommendation algorithm. If the treatment group experiences the new algorithm and receives a recommendation they really like, it’s probable that their likelihood of making a purchase will increase. However, in subsequent sessions when the user returns to make that purchase, there is no guarantee that they will fall into the treatment group again. This discrepancy can lead to a misattribution of the positive effect of the new algorithm.
Randomization at the session level, where each session is treated independently.
Let’s construct a simple simulation to explore scenarios like these. We’ll work with a hypothetical scenario involving 10,000 users, each of whom averages about two sessions. Initially, we’ll assume a baseline session conversion rate of approximately 10%. For sessions falling into the treatment group (version B experience), we’ll assume an uplift of around 2%, resulting in an average conversion rate of approximately 12%. For simplicity, we’ll make the initial assumption that the number of sessions per user and the session conversion rate are independent. In other words, a user with five sessions has the same baseline session conversion rate as someone with just one.
To begin, let’s assume that sessions are entirely independent. If a user like Bill experiences version B (treatment) in one session, their probability of converting during that session will be around 12%. However, if they return for another session that is assigned to the original version A experience (control), the session conversion rate reverts to the baseline 10%. In this scenario, the experience from the first session has no impact on the outcome of the next session.
Please refer to the appendix for the code used to simulate the experiment and the corresponding Bayesian implementation of the A/B test. After conducting this experiment multiple times, we observed the following results:
- The A/B test correctly identifies a positive effect 100.0% of the time (with a 95% “confidence” level).
- The A/B test detects an average effect size of 203 basis points (approximately 2%).
When sessions are genuinely independent, everything aligns with our expectations.
Randomization at the session level, considering non-independent sessions.
However, as previously mentioned, it’s highly improbable that sessions are entirely independent. Consider the product recommendation experiment example mentioned earlier. Suppose that once a user experiences a session in the treatment group, their session conversion rate permanently increases. In other words, the first session assigned to the treatment group and all subsequent sessions, regardless of assignment, now convert at 12%. Please review the implementation details in the appendix. In this modified scenario, we made the following observations:
- The A/B test correctly identifies a positive effect 90.0% of the time (with a 95% “confidence” level).
- The A/B test detects an average effect size of 137 basis points (approximately 1.4%).
With this “carryover effect” now in place, we find that we underestimate the true effect and detect a positive impact less frequently. This might not seem too concerning, as we still correctly identify positive effects. However, when handling smaller effect sizes, situations arise where this carryover effect leads to a permanent change in the user’s conversion. This causes us to completely miss detecting any effect.
It’s essential to emphasize that this analysis explores the most extreme scenario: 100% of the effect (the 2% increase) carries over indefinitely.
Randomization at the user level
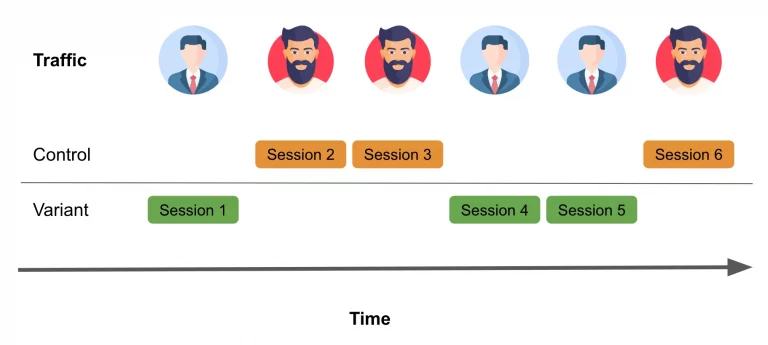
Opting for user-level randomization instead of session-level randomization can address the challenges posed by non-independent sessions. To circumvent the issues encountered with session-level randomization, we must make the assumption that the users themselves are independent and do not influence each other’s decision to convert. Let’s consider our loyal shoppers, Aaron and Bill, as an example of how user-level randomization would function:
In user-level randomization, each user consistently receives the same experience across all their sessions. After rerunning our simulation with user-level randomization and maintaining the same “carryover effects” as before, we observe the anticipated results:
- The A/B test correctly identifies a positive effect 100.0% of the time (with a 95% “confidence” level).
- The A/B test detects an average effect size of 199 basis points (approximately 2%).
With user-level randomization, we regain the expected outcomes, ensuring that users’ experiences remain consistent and independent across their sessions.
Recommendations…
If you suspect that your sessions may lack independence and could exhibit some carryover effects, it’s advisable to consider randomizing at the user level. Failing to do so may lead to an inaccurate estimation of the genuine impact of a particular change, or worse, result in the inability to detect any effect at all.
The magnitude of this issue will largely hinge on the specific domain you’re operating in. You’ll need to critically assess how substantial the carryover effects could be. Furthermore, the impact level will be influenced by the distribution of sessions within your user base. If the majority of your users visit your platform infrequently, on average, then this concern is less pronounced.
It’s important to note that user-level randomization typically involves the use of cookies to identify users. However, it’s worth acknowledging that this approach does not guarantee unit independence. Cookies serve as an imperfect representation of individuals because a single person may be associated with multiple “user cookies” if they switch browsers, devices, or clear their cookies. This should not deter you from implementing user-level randomization, as it remains the best method for mitigating non-independence and ensuring a consistent user experience.
Tip: Apply Guardrail Metrics
Given that these challenges described are prevalent in the majority of experiments and are challenging to eliminate, we have discovered an effective ensemble approach to minimize erroneous decisions.
Rather than concentrate solely on late-stage purchase funnel Key Performance Indicators (KPIs), it is advisable to augment them with earlier stage guard-rail KPIs. For instance, in addition to Average Revenue Per User (ARPU), it is recommended to incorporate Average Added Basket Value Per User (AABVPU). When conducting an experiment, if you observe a substantial disparity between these two KPIs, it may indicate an issue with assignment persistence. In such cases, making decisions solely based on the ARPU metric should be avoided without further investigation.
In closing, it’s important to emphasize that, in light of the potentially devastating consequences if rash business decisions are made on the back of faulty A/B testing, we concede that this approach doesn’t offer a foolproof solution to our challenges as well. We must navigate within the constraints of our imperfect world.
Apendix
All code needed to reproduce the simulations used can be found in this gist.