
In this article, I will show how to monitor Elasticsearch running inside Kubernetes using the Prometheus-operator, and later Grafana for visualization. Our sample will be based on the cluster described in my last article.
There are plenty of businesses that have to run and operate Elasticsearch on their own. This can be solved pretty well, because of the wide range of deployment types and the large community (an overview here). However, if you’re serious about running Elasticsearch, perhaps as a critical part of your application, you MUST monitor. In this article, I will show how to monitor Elasticsearch running inside Kubernetes using Prometheus as monitoring software. We will use the Prometheus-operator for Kubernetes, but it will work with a plain Prometheus in the same way.
Overview of Elasticsearch Monitoring using Prometheus
If we talk about monitoring Elasticsearch, we have to keep in mind, that there are multiple layers to monitor:
- The first layer is the Hardware Layer where we are monitoring the Hardware’s health, for example, the smart values of the disk.
- The second layer is the process-layer where we are monitoring the OS-Process health, for example, memory usage, CPU usage, etc.
- The third layer is the application layer, because Elasticsearch is written in Java, it’s running on top of a JVM (Java Virtual Machine), so we’re actually monitoring two applications. The JVM and Elasticsearch, which sits on top of the JVM.
Because most Companies have, hopefully, already been monitoring the hardware-layer and process-layer this article will concentrate on the Application-Layer. The following list gives you an overview of tools/types to help you monitor the Elasticsearch application:
- Elasticsearch and all the Virtualizations based on Elasticsearch monitoring indices (Elasticsearch itself: https://www.elastic.co/de/what-is/elasticsearch-monitoring)
- Sematext (https://sematext.com/blog/elasticsearch-open-source-monitoring-tools/)
- Zabbix (https://www.zabbix.com/integrations/elasticsearch)
- Nagios / Icinga (e.g. https://exchange.nagios.org/directory/Plugins/Databases/Others/check_es_system-ElasticSearch-monitoring/details)
- Check_MK (https://checkmk.com/check_mk-werks.php?werk_id=7202)
- Prometheus (e.g. https://github.com/vvanholl/elasticsearch-prometheus-exporter)
- and many more
It is worth noting that every one of these methods uses the Elasticsearch internal stats gathering logic to collect data about the underlying JVM and Elasticsearch itself.
The Motivation Behind Monitoring Elasticsearch Independently
Elasticsearch already contains monitoring functionality, so why try to monitor Elasticsearch with an external monitoring system? Some reasons to consider:
- If Elasticsearch is broken, the internal monitoring is broken
- You already have a functioning monitoring system with processes for alerting, user management, etc.
In our case, this second point was the impetus for using Prometheus to monitor Elasticsearch.
Let’s Get Started – Install the Plugin
To monitor Elasticsearch with Prometheus, we have to export the monitoring data in the Prometheus exposition format. To this end, we have to install a plugin in our Elasticsearch cluster which exposes the information in the right format under /_prometheus/metrics. If we are using the Elasticsearch operator, we can install the plugin in the same way as the S3 plugin, from the last post, using the init container:
version: 7.7.0
...
nodeSets:
- name: master-zone-a
  ...
  podTemplate:
    spec:
      initContainers:
      - name: sysctl
        securityContext:
          privileged: true
        command: ['sh', '-c', 'sysctl -w vm.max_map_count=262144']
      - name: install-plugins
        command:
        - sh
        - -c
        - |
          bin/elasticsearch-plugin install -b repository-s3 https://github.com/vvanholl/elasticsearch-prometheus-exporter/releases/download/7.7.0.0/prometheus-exporter-7.7.0.0.zip
  ...
If you are not using the Elasticsearch-operator, you have to follow the Elasticsearch plugin installation instructions.
Please note: there is more than one plugin on the market for exposing elasticsearch monitoring data in the Prometheus format, but the Elasticsearch-prometheus-exporter we are using is one of the larger projects which is active and has a big community.
If you are using elasticsearch > 7.17.7 (including 8.x), take a look at the following plugin instead: https://github.com/mindw/elasticsearch-prometheus-exporter/
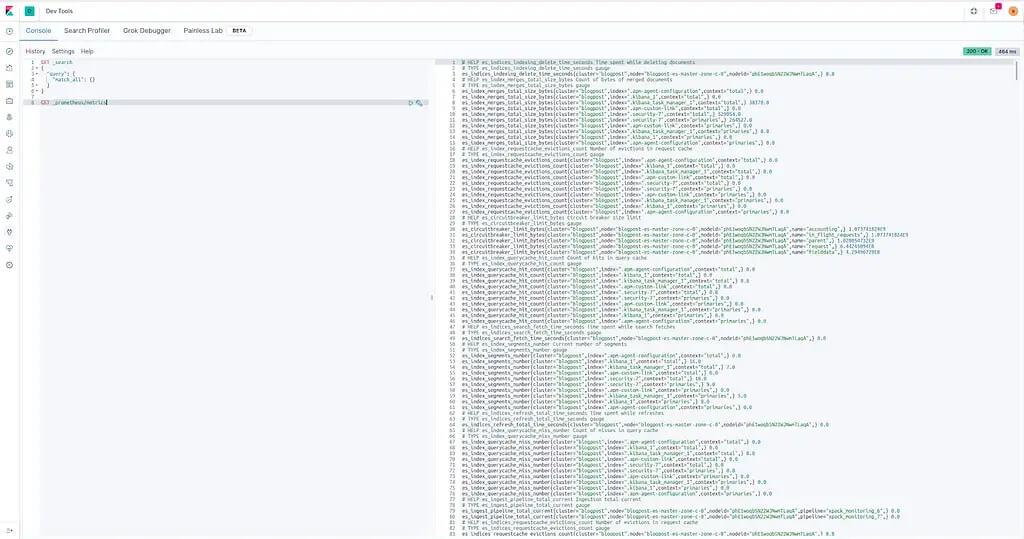
After installing the plugin, we should now be able to fetch monitoring data from the /_prometheus/metrics endpoint. To test the plugin, we can use Kibana to perform a request against the endpoint. See the picture below:
How To Configure Prometheus
At this point, it’s time to connect Elasticsearch to Prometheus. Now, we can create a ServiceMonitor because we are using the Prometheus-operator for monitoring internal Kubernetes applications. See an example below, which can be used to monitor the Elasticsearch cluster we created in my last post:
apiVersion: monitoring.coreos.com/v1
kind: ServiceMonitor
metadata:
  labels:
    app: prometheus
    prometheus: kube-prometheus
    chart: prometheus-operator-8.13.8
    release: prometheus-operator
  name: blogpost-es
  namespace: monitoring
spec:
  endpoints:
    - interval: 30s
      path: "/_prometheus/metrics"
      port: https
      scheme: https
      tlsConfig:
        insecureSkipVerify: true
      basicAuth:
        password:
          name: basic-auth-es
          key: password
        username:
          name: basic-auth-es
          key: user
  namespaceSelector:
    matchNames:
    - blog
  selector:
    matchLabels:
      common.k8s.elastic.co/type: elasticsearch
      elasticsearch.k8s.elastic.co/cluster-name: blogpost
For those unfamiliar with the Prometheus-operator or are using plain Prometheus to monitor Elasticsearch. The ServiceMonitor will create a Prometheus job like the one below:
- job_name: monitoring/blogpost-es/0
  honor_timestamps: true
  scrape_interval: 30s
  scrape_timeout: 10s
  metrics_path: /_prometheus/metrics
  scheme: https
  kubernetes_sd_configs:
  - role: endpoints
    namespaces:
      names:
      - blog
  basic_auth:
    username: elastic
    password: io3Ahnae2ieW8Ei3aeZahshi
  tls_config:
    insecure_skip_verify: true
  relabel_configs:
  - source_labels: [__meta_kubernetes_service_label_common_k8s_elastic_co_type]
    separator: ;
    regex: elasticsearch
    replacement: $1
    action: keep
  - source_labels: [__meta_kubernetes_service_label_elasticsearch_k8s_elastic_co_cluster_name]
    separator: ;
    regex: ui
    replacement: $1
    action: keep
  - source_labels: [__meta_kubernetes_endpoint_port_name]
    separator: ;
    regex: https
    replacement: $1
    action: keep
  - source_labels: [__meta_kubernetes_endpoint_address_target_kind, __meta_kubernetes_endpoint_address_target_name]
    separator: ;
    regex: Node;(.*)
    target_label: node
    replacement: ${1}
    action: replace
  - source_labels: [__meta_kubernetes_endpoint_address_target_kind, __meta_kubernetes_endpoint_address_target_name]
    separator: ;
    regex: Pod;(.*)
    target_label: pod
    replacement: ${1}
    action: replace
  - source_labels: [__meta_kubernetes_namespace]
    separator: ;
    regex: (.*)
    target_label: namespace
    replacement: $1
    action: replace
  - source_labels: [__meta_kubernetes_service_name]
    separator: ;
    regex: (.*)
    target_label: service
    replacement: $1
    action: replace
  - source_labels: [__meta_kubernetes_pod_name]
    separator: ;
    regex: (.*)
    target_label: pod
    replacement: $1
    action: replace
  - source_labels: [__meta_kubernetes_service_name]
    separator: ;
    regex: (.*)
    target_label: job
    replacement: ${1}
    action: replace
  - separator: ;
    regex: (.*)
    target_label: endpoint
    replacement: https
    action: replace
Warning!: in our example, the scrape interval is 30 seconds. It may be necessary to adjust the interval for your production cluster. Proceed with caution! Gathering information for every scrape creates a heavy load on your Elasticsearch cluster, especially on the master nodes. A short scrape interval can easily kill your cluster.
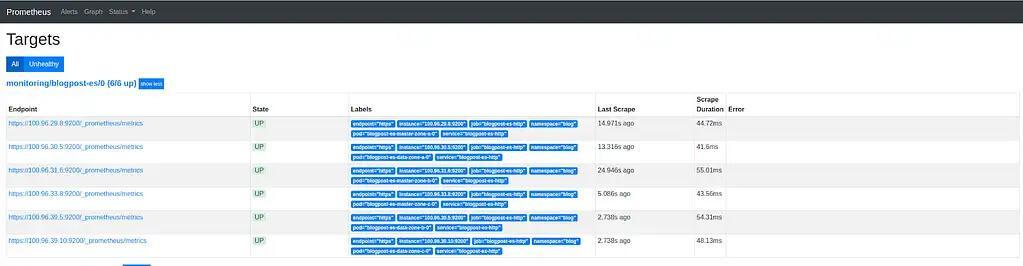
If your configuration of Prometheus was successful, you will now see the cluster under the “Targets” section of Prometheus under “All”. See the picture below:
Import Grafana-Dashboard
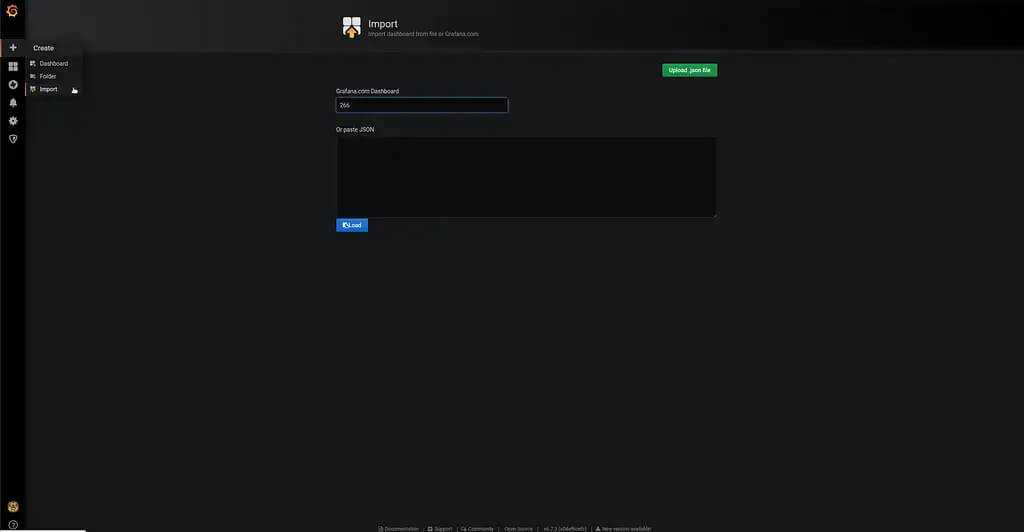
Theoretically, we are now finished. However, because most people out there use Prometheus with Grafana, I want to show how to import the dashboard especially made for this plugin. You can find it here on grafana.com. The screenshots below explain how to import the Dashboard:
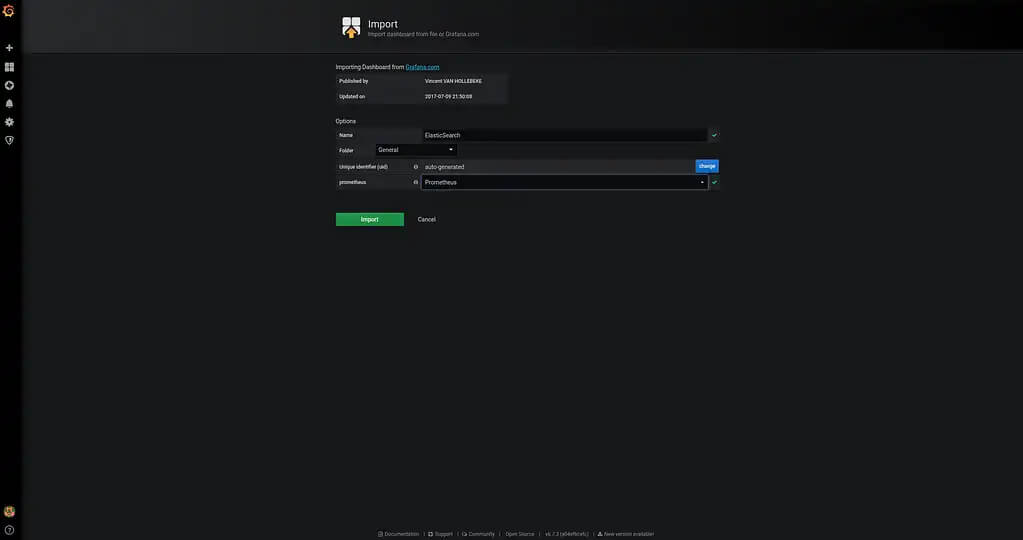
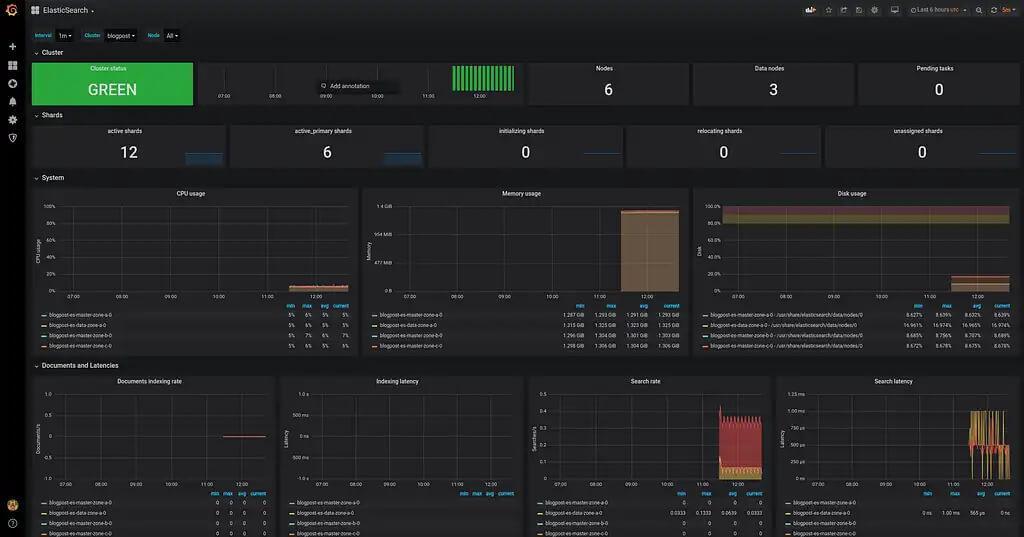
Following the dashboard import, you should see the elasticsearch monitoring graphs as in the following screenshot:
Wrapping Up
In this article, we briefly covered the possible monitoring options. I showed why it makes sense to monitor elasticsearch using an external monitoring system and some reasons for doing so. Finally, I showed how to monitor Elasticsearch with Prometheus and Grafana for visualization.